Overview
In this project, we implemented functions to rasterize triangles with different advanced techniques for coloring them to look better, including super sampling, use of barycentric coordinates, and We have learned
Section I: Rasterization
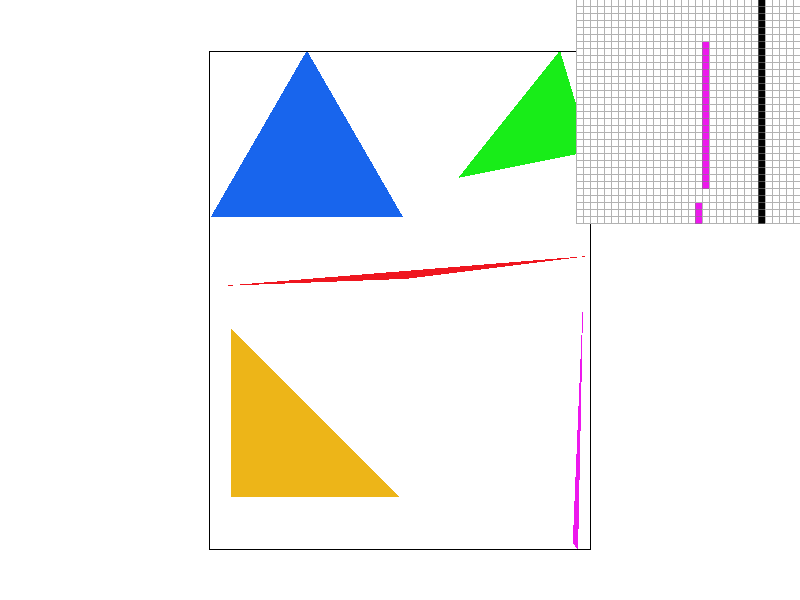
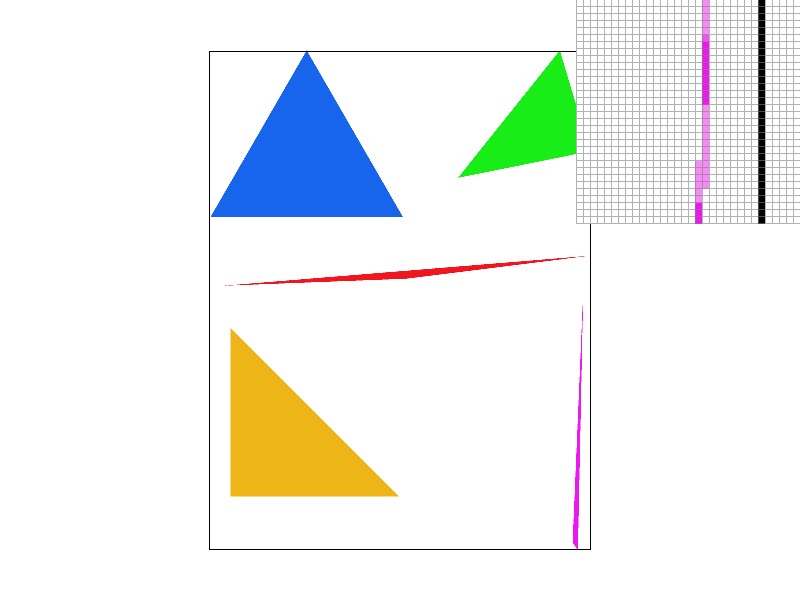
Part 1: Rasterizing single-color triangles
|
To rasterize triangles, we loop through all points that could possibly be in the triangle and check to make sure they are in the triangle. If our test returns that they are in the triangle, then we fill that pixel with the appropriate color. To implement our test, we created a new function called point_in_triangle that takes in the coordinates of a point as well as the coordinates of the corners of the triangle and returns a bool. The function calculates all three line test values for the point and each pair of corners, and returns whether all of their signs are the same. Our naïve implementation of rasterization calculated very slowly, often taking multiple seconds to update after only a small change in image magnification. This inefficiency was caused by us checking all points in the entire bounds of the image. We improved this by only checking points from the smallest x and y values to the largest x and y values out of all the x and y values for the corners of the triangle passed into the rasterize_triangle function. We also make sure that the triangle does not exceed the bounds of the image, so that the program does not attempt to fill pixels that are outside of the image and crash. |

|
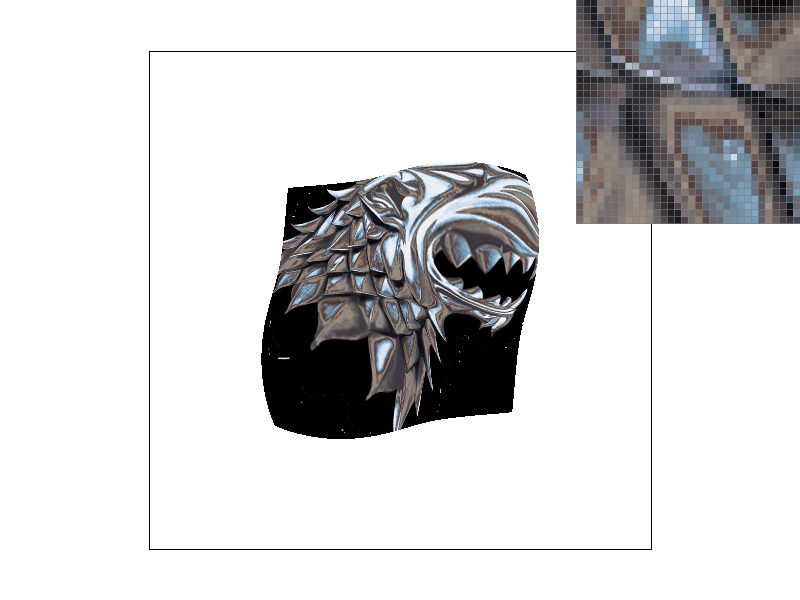
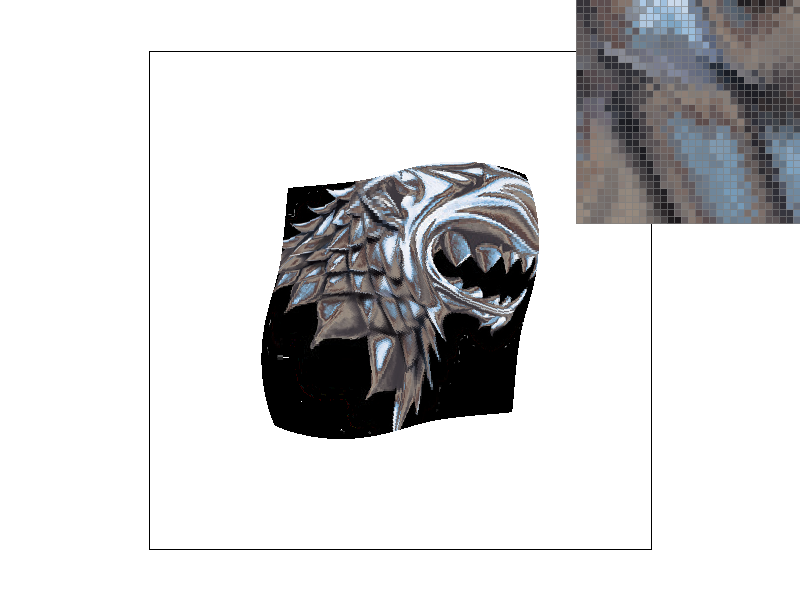
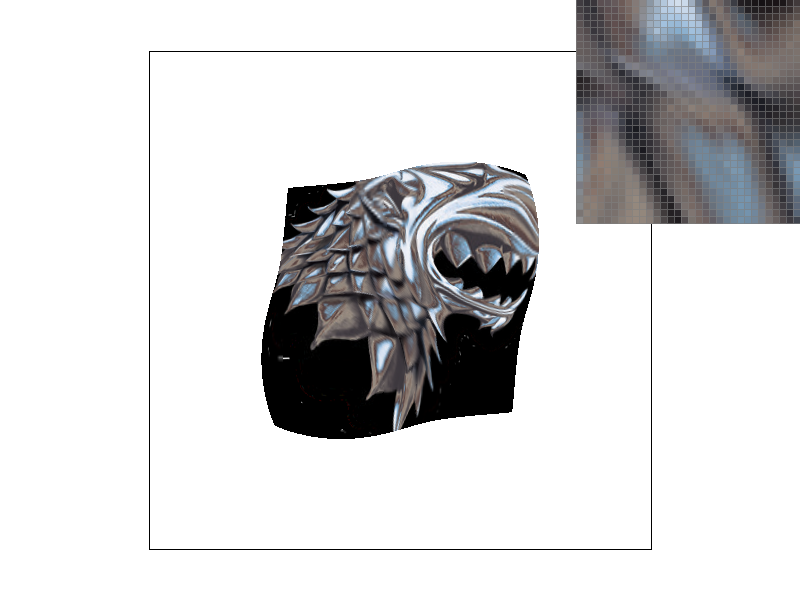
Part 2: Antialiasing triangles
|
|

|
Super sampling is useful because it allows for more precise coloring than the binary scheme of "is center of this pixel in the triangle or not" (it becomes closer to "what percent of this pixel is in the triangle"). It makes edges look smoother, removing jaggies. One can see this from the differences in the above images--the edges of all triangles look much smoother. In specific, the pink triangle in the image without supersampling is looks disconnected, while it looks much better in the image with supersampling rate 16. One can clearly see the reason for this in the pixel inspector--the end of the pink triangle actually is disconnected in the image without supersampling, while it is connected by a lighter color pink in the image with supersampling rate 16.
To implement supersampling, we had to modify the rasterize_triangle method, as well as the way the sample buffer was used (in fill_pixel, set_sample_rate, set_framebuffer_target, and resolve_to_frame_buffer). We modified the rasterize_triangle method by adding two more nested for loops so that we could check multiple points in each pixel. If a tested point is in the triangle, fill_pixel is called on it. fill_pixel then adds it to the sample_buffer. The sample_buffer was changed to take the sampling rate into account when it was set, multiplying its size by the sample rate. Then, in resolve_to_frame_buffer, all point color values for each pixel extracted from the sample_buffer and averaged, and the pixel is set to that average color.
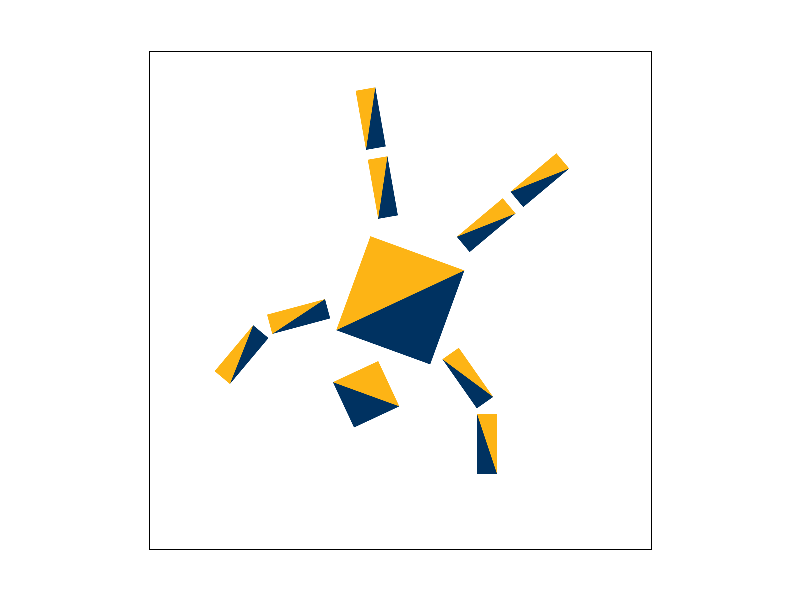
Part 3: Transforms
|
In this image, we have changed cube man into Berkeley man. He is doing a cartwheel, demonstrating his superior athletic skills (Stanfurd man barely has the strength to lift his body out of his chair, nevermind doing any sorts of acrobatics!). We changed cube man into Berkeley man by editing the fill colors of all the polygons, and showed him doing a cartwheel by rotating his whole body by 200 degrees, and then rotating several of his limbs/limb parts. We also adjusted the limb part translations so that their positions still looked natural. |
|
Section II: Sampling
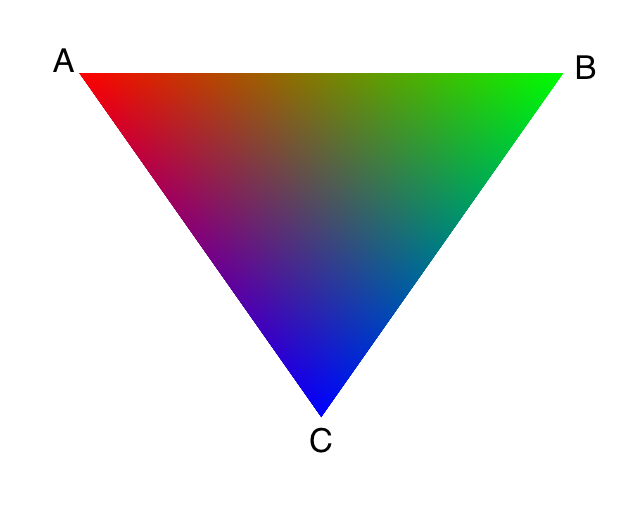
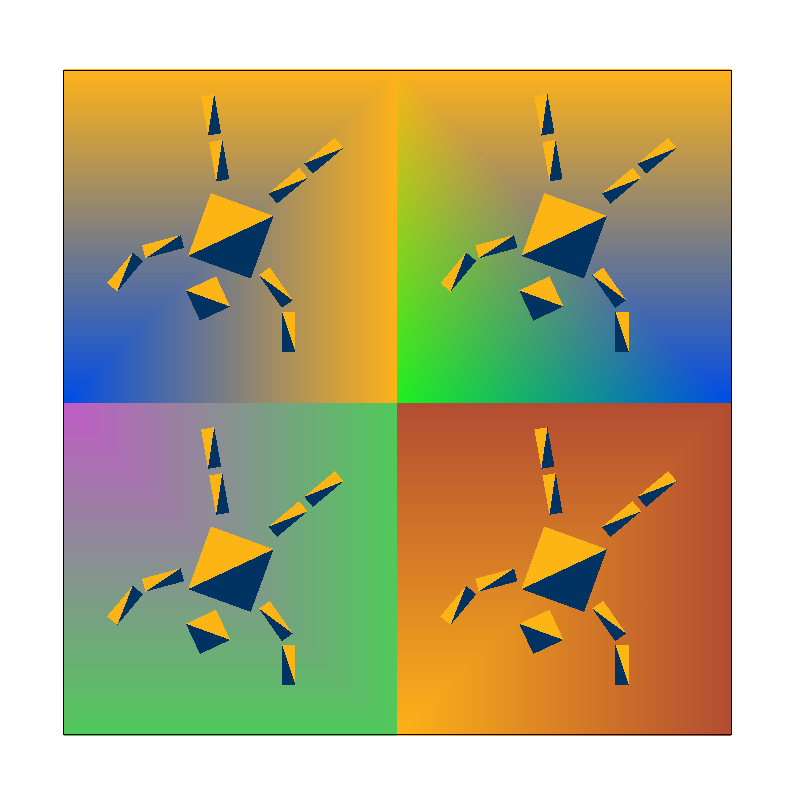
Part 4: Barycentric coordinates
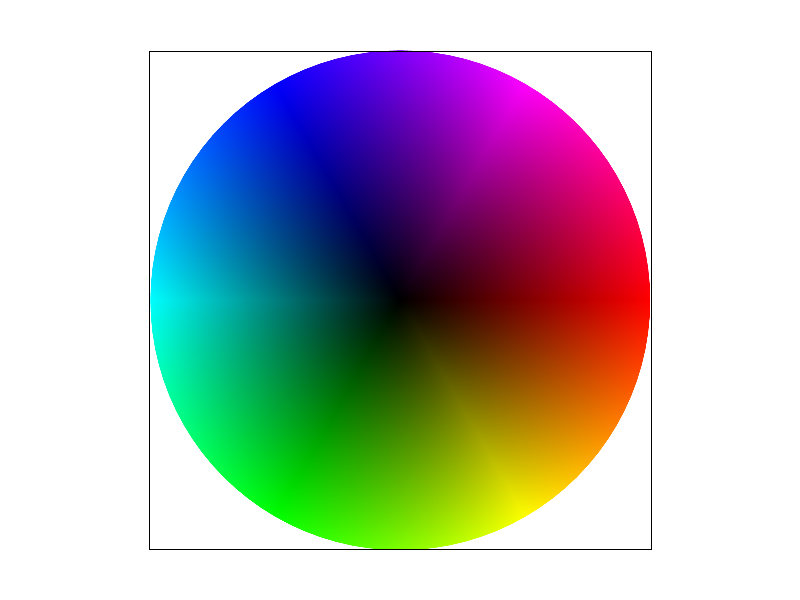
Barycentric coordinates are a coordinate system for uniquely specifying the location of a point inside of a triangle. Each point is represented by three numbers ranging from 0 to 1 (denoted alpha, beta, and gamma). Alpha is a measure of how close the point is to the first vertex (1 if it is the first vertex, and 0 if it is on the opposite line). After drawing a line from the first vertex to the opposite line that passes through the point, alpha can be calculated as the fraction of the line that is between the point and the line opposite the first vertex. (Beta is the same for the second vertex, and gamma is the same for the third.) Alpha, beta, and gamma have the property of always summing to 1.
|
In the image to the right, the triangle is rasterized with colors according to the barycentric coordinates of the points. Vertex A has color red (#ff0000), Vertex B has color green (#00ff00), and Vertex C has color blue (#0000ff). A point with coordinates (1,0,0), (0,1,0), or (0,0,1) would be all red, green, or blue, respectively, while a point with coordinates (1/3, 1/3, 1/3) would be an even mix of red, green, and blue, and a point with similar first and third coordinates and low second coordinate would be purple. The below inputs are changeable and will display the color of a point in the aforementioned triangle with alpha, beta, and gamma values of your choosing (assuming scripts are enabled on the page). |
|
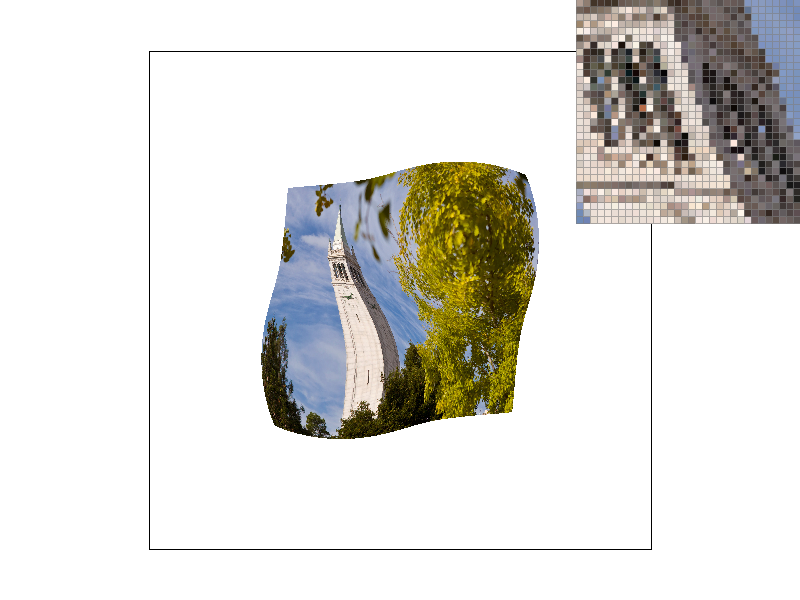
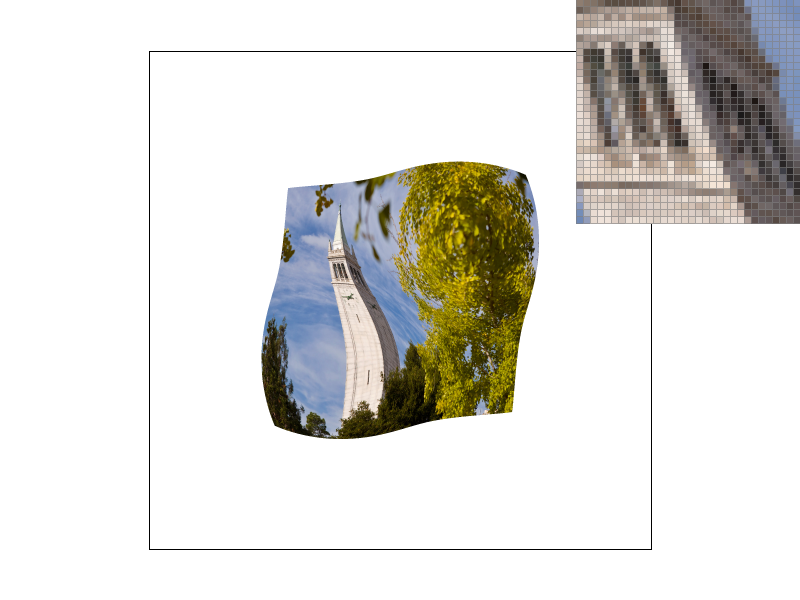
Part 5: "Pixel sampling" for texture mapping
Pixel sampling is a method of changing the resolution of a given image. It is a way to map an image with higher or lower resolution to a lower or higher resolution, respectively. Or to put it in simple terms, it smooths an image by filling in colors in between predetermined pixels.
To implement pixel sampling, weimplemented the sample_nearest and sample_bilinear method in texture.cpp, and in the rasterize_textured_triangle function, we calculated the uv coordinate of the sample point in texture space and pass them into the sample function. We utilize the fact that the barycentric coordinate of points the sample space is consistent with the barycentric coordinate of points in texture space to convert between the two coordinates.
Nearest pixel sampling of a pixel simply takes the closest sample in the texture space and assign the pixel to have that texture. On the other hand, bilinear resampling interpolate the current pixel by performing a weighted sum between the four closest texture pixels. The result of all this is that bilinear resampling often blurs out spaces between pixels and provides a smoother transition, while nearest resampling results in sharper transitions.
|

|
|

|
From the 4 images of Campanile above, we ca clearly see that that when the sampling rate is low (e.g. 1) the image rendered using bilinear resampling shows less aliasing and appears to be higher resolution. Similarly, even though it is less obvious when sampling rate is high (e.g. 16), we can still see bilinear resampling results in a smoother images while nearest resampling displays worse jaggies.
Part 6: "Level sampling" with mipmaps for texture mapping
Level samplings are method that improves on the pixel sampling from previous step. It is clear that when textures are crowded, we would not want to use pixel sampling, as it will overcomplicate that single pixel, and this is where level sampling can help. When the texture of an image is rapidly changing, we would want a lower resolution to resample from and vice versa.
To implement level sampling, we used the given SampleParams data to pass in different parameters. The parameters contained in this structures include the level sampling method, the pixel sampling method, uv coordinate, and the uv coordinates of the sample one pixel to the right and one pixel under. We also implemented the get_level method in tuxture.cpp that calculates the mipmap level of the sample in according to the formula given in class. Lastly, in the sample method, we pass all these parameters into the appropricate helper functions depending on the sampling method.
When we talk about performance, increasing the sample rate with super sampling is definitely the slowest of the three techniques and also the most memory hungry. This is due to the fact that we need to sample a lot more times and we need a larger sample buffer to store these samples. Level sampling and pixel sampling are pretty much identical in terms of speed and do not increase the memory usage. Yet, they are both worse in terms of antialiasing power compared to supersampling. Supersampling is the best when it comes to removing the aliasing effect of the image, followed by level sampling, and then pixel sampling as the worst.
Below is the effect of different combination of sampling techniques
|
|
|
|
Section III: Art Competition
Part 7: Draw something interesting!
|
Inspired by our changes to Cube man in number 3, we thought to ourselves, "What could be better than Berkeley man?" The answer is obvious: four Berkeley men! We made this by expanding the canvas from 500x500 to 1000x1000, then pasting the Berkeley man group four times, and editing the translations such that one Berkeley man would appear in all four corners of the screen. We also generated backgrounds for each Berkeley man using colortri's with colors that were randomly chosen, then tuned to be more Berkeley-ish. |
|
Link to webpage: https://cal-cs184-student.github.io/sp22-project-webpages-rasterfarians/proj1/index.html